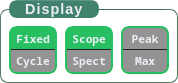
Display controls
Configures how waveform data is visually presented, including real-time refresh modes, display style (oscilloscope or spectrum), and peak detection overlays.
Waveform Display Configuration
The Display Controls determine how the waveform is rendered on-screen, offering both visual modes and analysis tools to support real-time signal observation and interpretation.
These controls affect how the waveform behaves during playback or live data acquisition, including refresh behavior, signal mode, and overlay markers.
Buttons and Functionality
- Fixed / Cycle (toggle) — Switches between waveform refresh modes:
- Fixed mode holds the waveform in place as new data enters from right to left.
- Cycle mode continuously scrolls the waveform across the screen, looping in real-time.
Note: Placeholder — confirm precise behavior later if needed.
- Scope / Spect (toggle) — Toggles the waveform between:
- Scope mode — traditional time-based waveform display (oscilloscope style).
- Spect mode — frequency-based visualization (spectrum analyzer).
This allows users to shift between time-domain and frequency-domain signal interpretation based on the type of signal activity they wish to observe.
- Peak / Max / Off (tri-state) — Cycles through three display marker modes:
- Peak — overlays a horizontal line at the most recently detected signal peak.
- Max — overlays a line at the highest signal level detected in the current session.
- Off — removes both overlays.
This tool is useful for identifying consistent patterns, high-activity bursts, or stress-induced signal changes in the plant.
Note: Placeholder — revise if needed to match code behavior.
Usage Notes
These controls are visual aids only and do not alter the underlying signal data or recording output. They provide clarity and interpretability during long-term monitoring, experimentation, or teaching scenarios.